PRINTMYPOSTER
CASE STUDY
I Built a Culture brand with 40% Conversion rate.
The Business Still Failed.
And why brand fit and business viability are completely different things.
Timeline
Dec 2023-
Oct 2025
Industry
D2C /
E-commerce
Role
Founder &
Brand Communication
Artifact type
Post-Mortem
Business Analysis

1. The Box
Custom Flat-Ship Carton
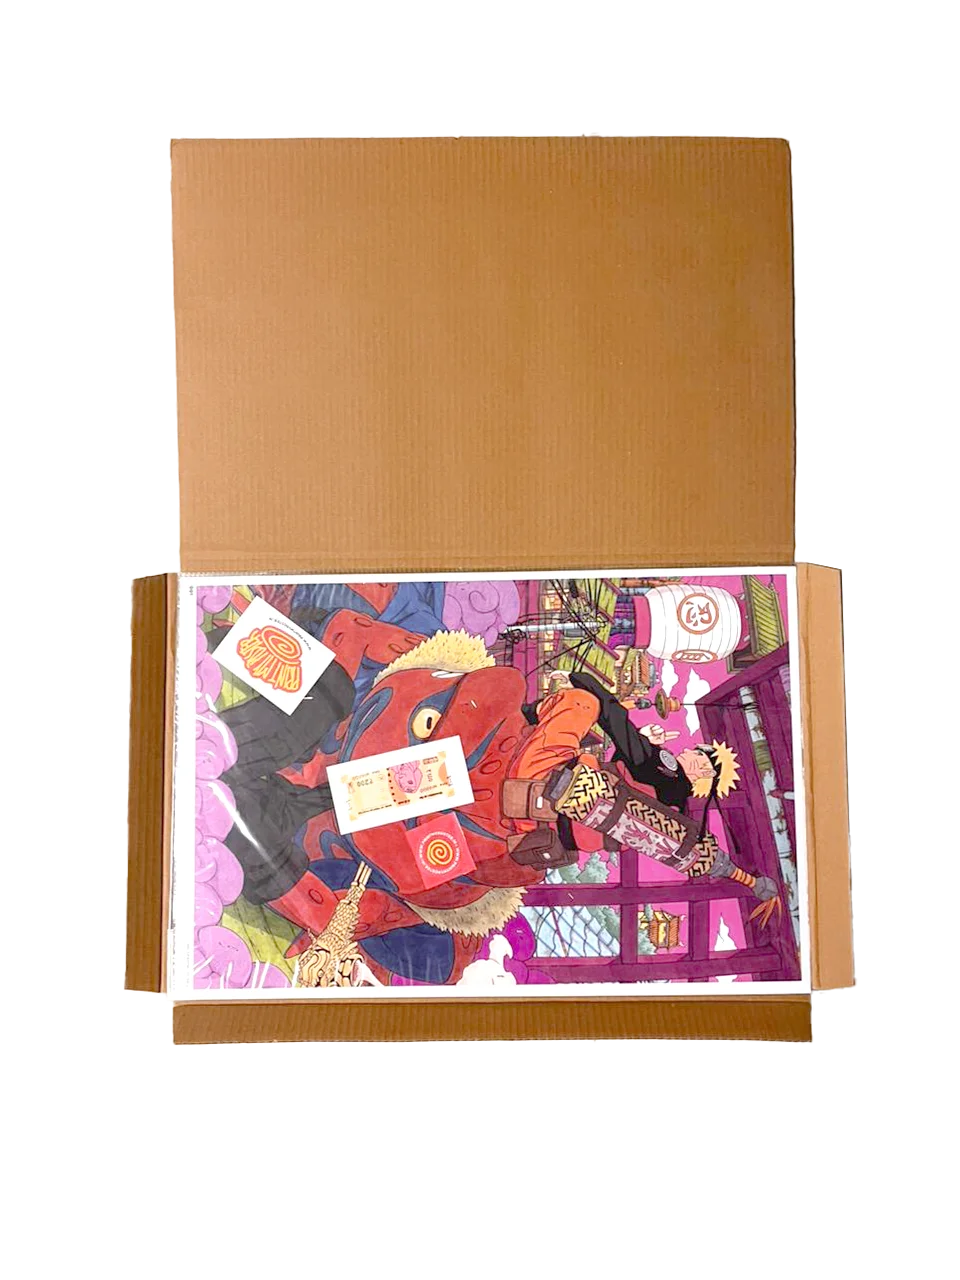
2. The Open
File style
3. The Extras
Stickers & Thank You
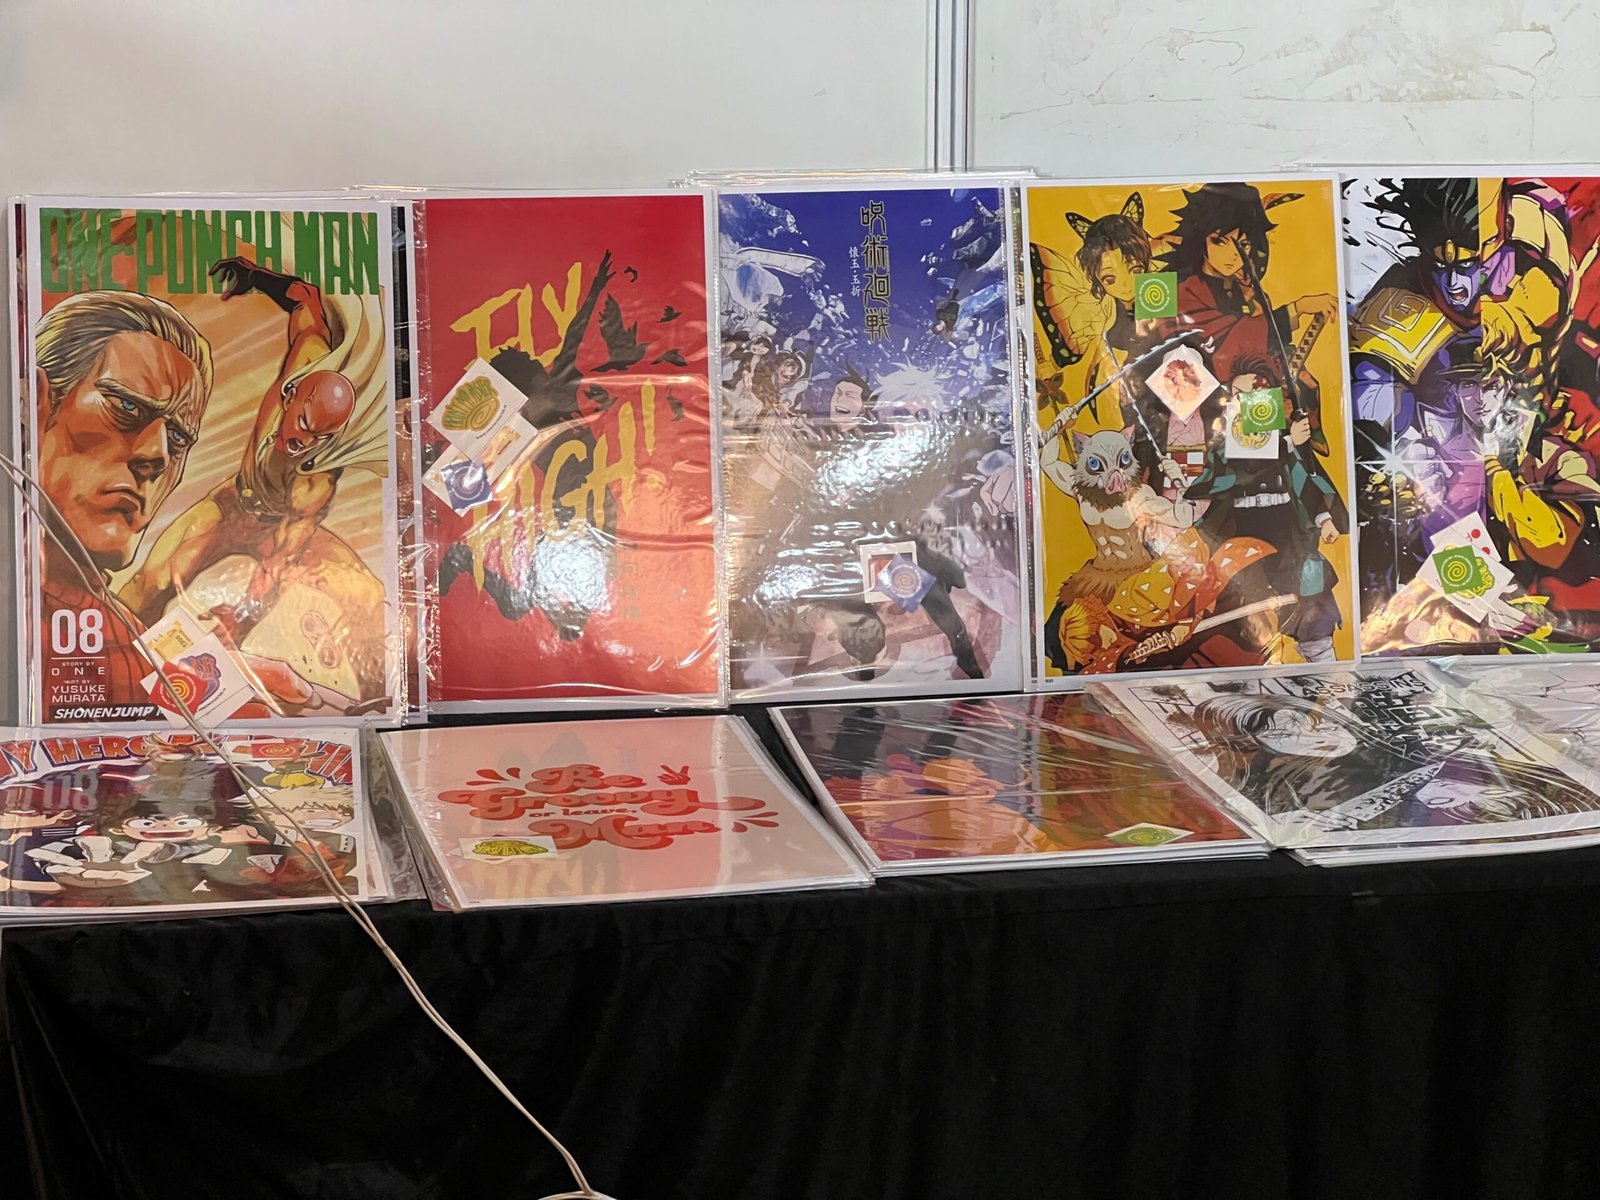
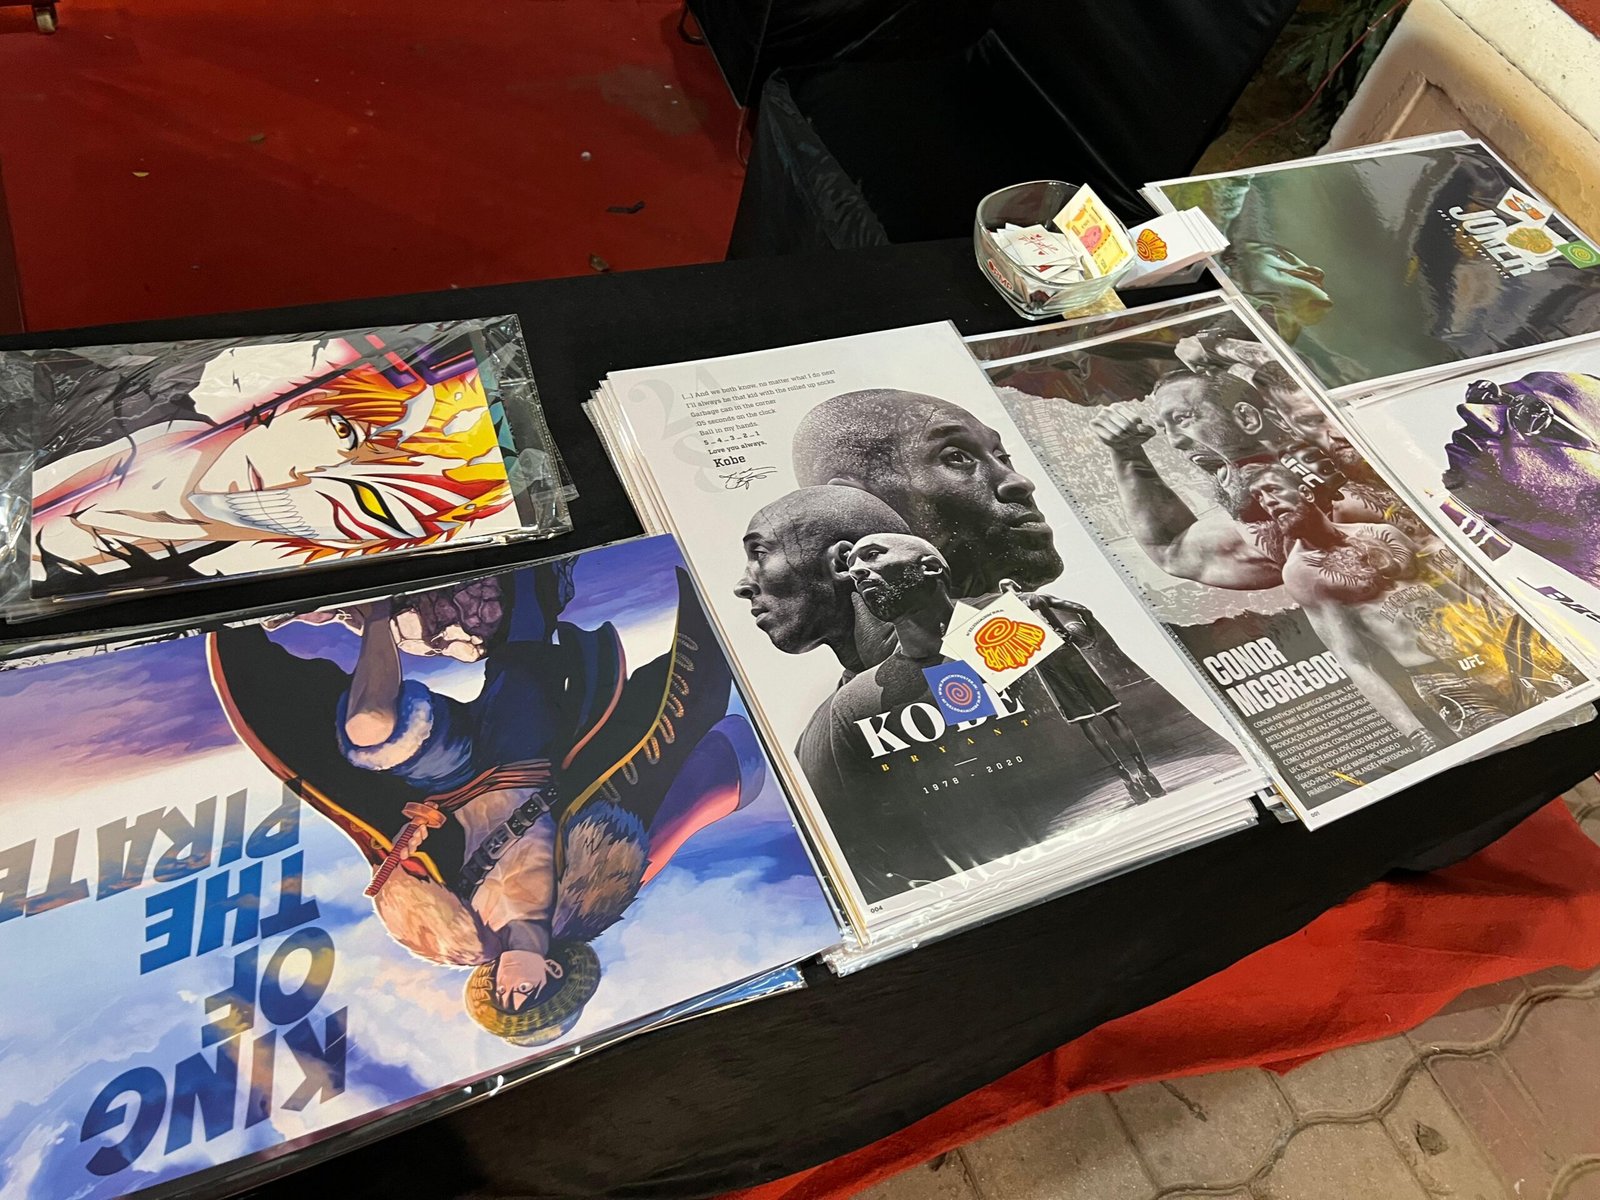
4. The Product
Wall Adhesive Ready
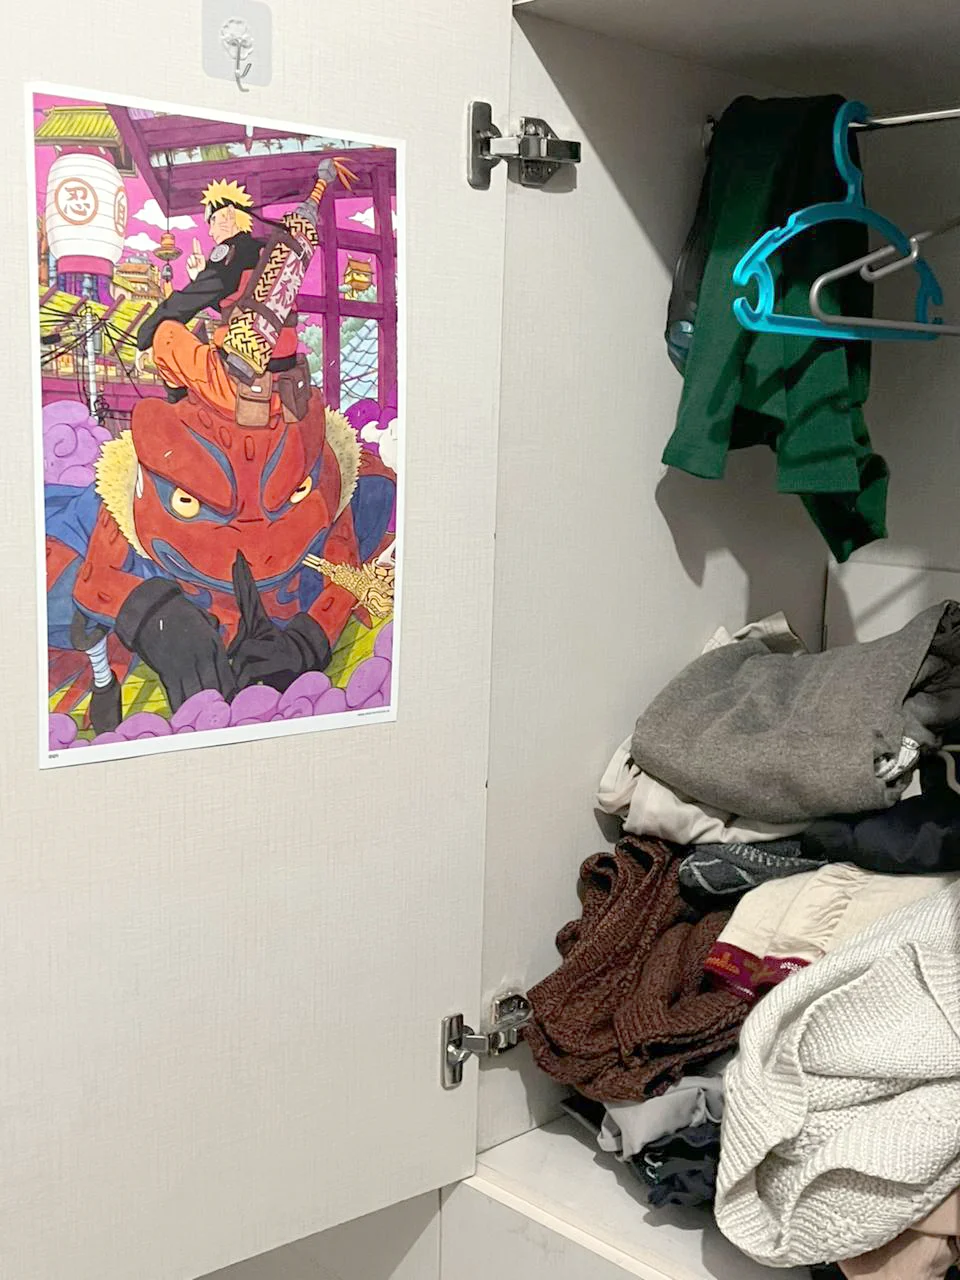
5. The Wall
Double-sided Tape Ready
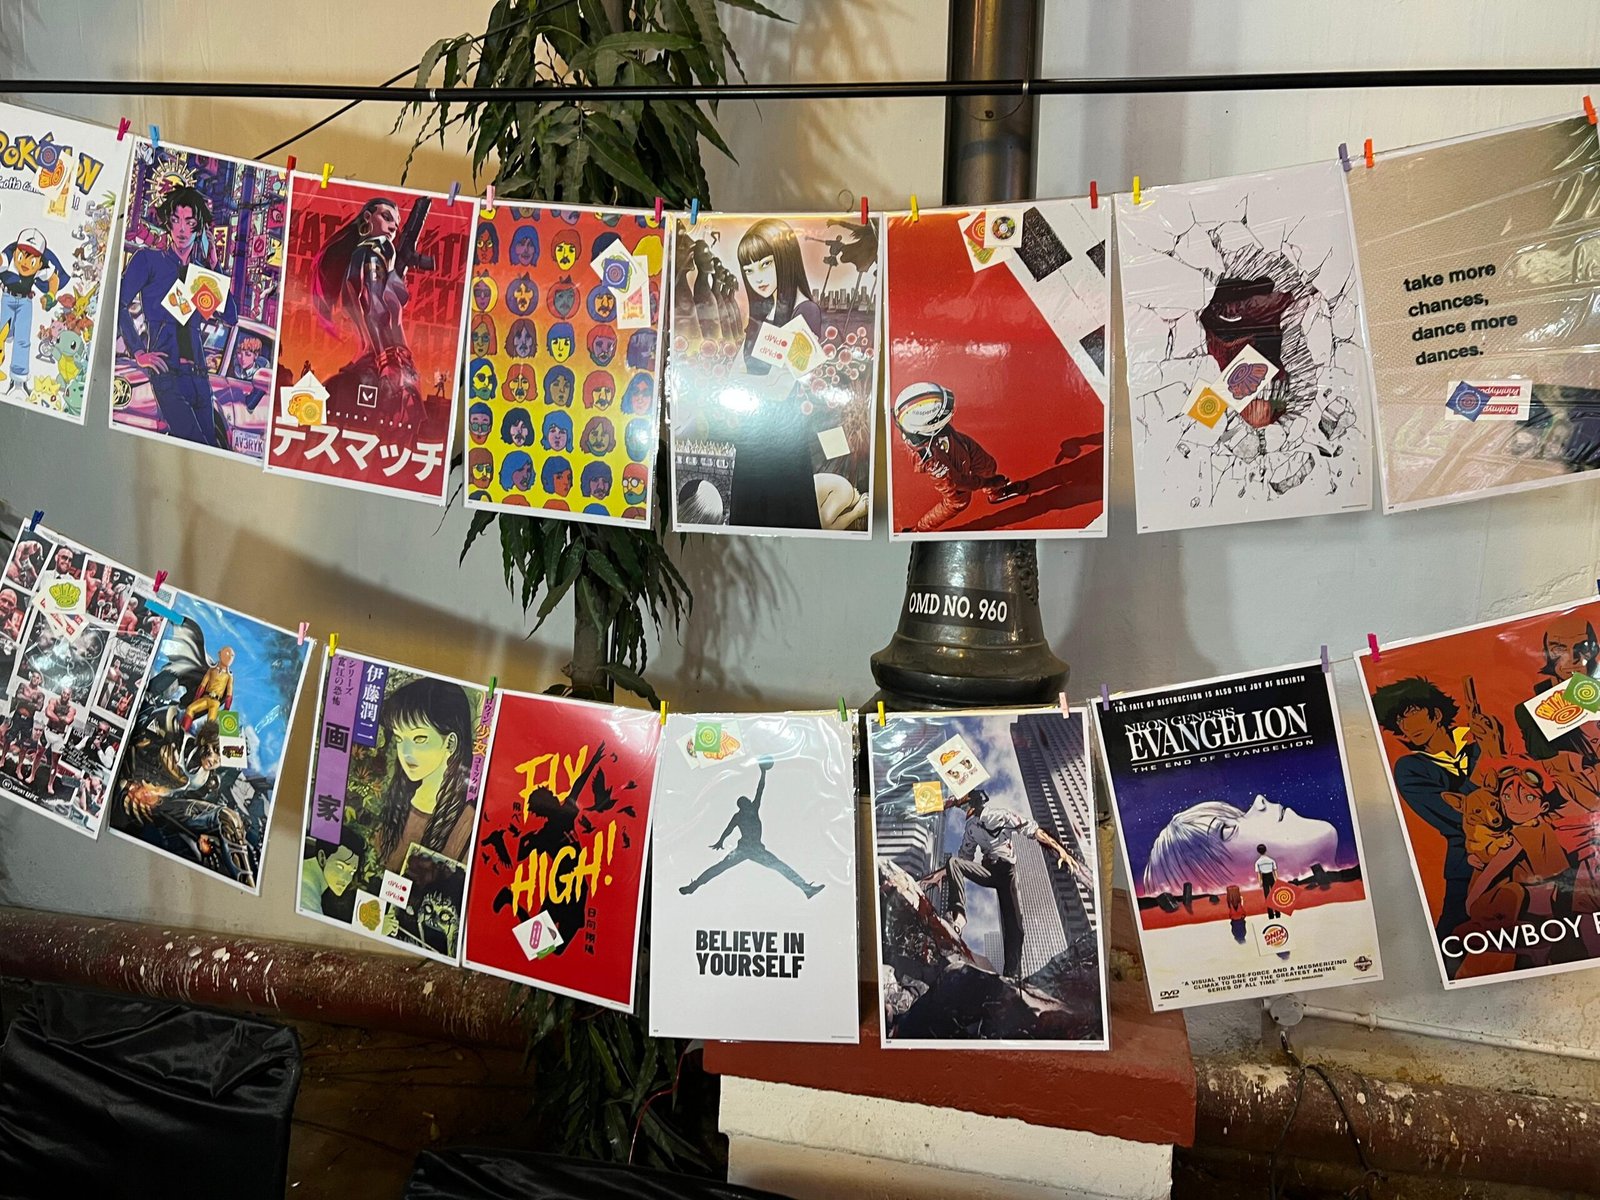
Offline(Stall)


My Learnings?
PrintMyPoster failed. But it was the best mini MBA I could have gotten.
For ₹100k tuition, I learned:
✓ How startups could die (bad unit economics)
✓ How to ask better questions (business first)
✓ How to read financials (CAC, LTV, unit economics)
✓ How to validate before scaling (profitability checkpoints)
✓ How to think like a founder (outcomes> aesthetics)
But the biggest lessons weren’t about unit economics. They were about human.
FOUNDER LESSON #1: Business Happens Over Lunch?
I learned that I need to be willing to talk about business at lunch table.
Not just in meetings. Not just in decks. At lunch too.
I found I ought to have difficukt conversations like:
“This isn’t working. What do we actually do?”
COLLABORATION LESSON #2: Knowing When to Let Go
There were times I knew more than Abhinav about Brand Building.
There were times he knew more than me about operations.
I had to accept that neither of us needed to be right all the time. Having a better idea doesn’t mean I should force it.
Because even if I win the argument, I lose the collaboration.
And I learned that collaboration moves things faster than my individual brilliance ever will.
I stopped counting who was right. Started counting if we were aligned.
That shift has my daily life and choices immensly in a positive way.
ASYNC LESSON #3: Written Communication Matters
There were weeks neither of us could meet. Different schedules. Different availability. One day we decided to use Google Notes and it did wonders for us. I learned to put everything in writing.
Like async-first companies do. I found it forced me to be clear.
It prevented misunderstandings. This kept my momentum without the need of always waiting to meet before working.
EFFICIENCY PARADOX #4: Meetings Have Hidden Value
Sometimes we had meetings that seemed pointless to me.
I’d think: “This is wasting my time. We’re not solving anything.”
But efficiency isn’t the only thing that moves business. Sometimes we need the “feel” of things happening.
Sometimes random meetings create momentum that prevents stalling.
(Obviously, one should audit this monthly, if they don’t want to become a meeting company.)
KNOW YOUR PARTNER ASAP #5: Know Your Partner’s Working Mind
I learned something crucial while working with Abhinav.
I realized I need to check something deeper: Do I know how they think when working?
Do I know what ideas they hate and love?
Do I know when they’ll push back and when they’ll go along?
Do I know their pace? Their communication style? Their decision-making process? If I don’t, then I have to get to know as soon as possible. It does not just limit to Business partners, it can be even for a small group project. Getting to know your partner is first thing you, or atleast I need to do before getting on with producing output.
ENGING NOTE
PrintMyPoster in numbers may look like a massive failure. But in personal development, it has taught me so much that the numerical failures look so utterly small. I am thankful for working on this project.
Powered by Bank of PrintMyPoster & the power of 200 rupee Note